
LENS is a web-based tool to carry out interactome analyses of human genes. LENS takes one or two lists of genes and determines a network of protein-protein interactions that connects them. LENS also performs some simple statistics about network connectivity which are compared against randomly generated networks and associations of the genes to diseases, drugs, pathways, and GWASs.
The Basics
On the home-page of LENS, you can input a list of genes for analysis, one gene per line. LENS accepts recognized HUGO symbols, UniProt identifiers, and Entrez identifiers.
If you'd rather look at a list of genes associated with a disease, drug, pathway, or GWAS,
you can type a partial name of the disease, drug, pathway or GWAS of interest to you in the text box at the right.
While you type the name, the box shows auto-complete options; upon selecting any of these options, the list of genes will be populated automatically on the left.
Analysis with two lists of genes
Sometimes, it is interesting to see whether the interactome of Candidate Genes connects closely to another set of genes ("Target Genes"), say those of a pathway or disease-association, or simply a list of genes of your interest. For example, do your candidate genes connect with Alzheimer's disease associated genes?To enter a Target Gene list, click the "Add Target Gene Set" button just below the Candidate genes. You can enter Target Gene list similarly as before, namely by entering gene ids or by selecting a specific pathway by entering its name on the box on the right.
The Network
The network consists of- protein-protein interactions of the Candidate genes
- protein-protein interactions that comprise the shortest paths from a Candidate Gene to the closest Target Gene if a target gene list is given; if Target Genes are not given, then shortest paths from a Candidate Gene to the closest Candidate Gene. In either case, if a Candidate Gene has multiple "closest neighbors", then shortest paths are shown to all of the closest neighbors.
Interactome Network Visualization
Red colored nodes: Candidate Genes given are represented by red circles in the network and will have their immediate interactors included.
If only the candidate list is given, LENS will attempt to connect the genes by finding the shortest paths between them.
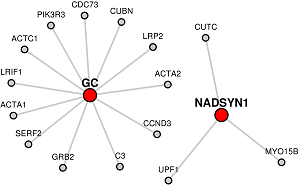
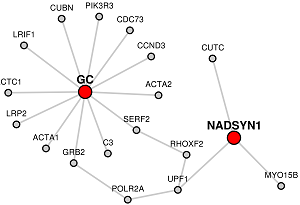
Blue colored nodes: Target genes will be represented by blue circles in the network and will not include their immediate interactors.
When target genes are given, LENS will attempt to connect the candidate genes to the target genes instead of to each other.
Orange colored nodes: If some genes are the common to Candidate and Target lists lists, they will be colored orange instead.
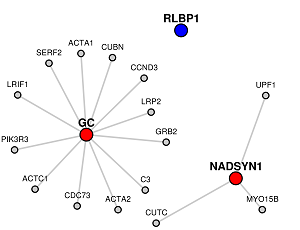
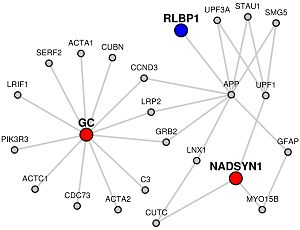
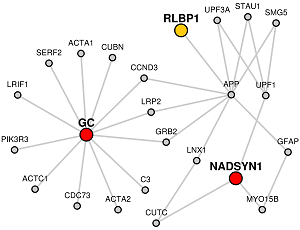
Grey colored nodes: Genes that are neither in Candidate nor Target list, are shown as grey nodes.
Interacting With The Network
The network visualization is interactive. You can click and drag the nodes around to customize your image.
Holding the shift key while clicking and dragging will allow you to select several nodes at once.
Selected nodes will be outlined in green and can be manipulated as a group. A single click in the white space will deselct the nodes.
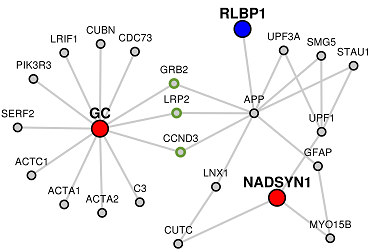
The initial network layout uses a force-directed layout algorithm. If you would like to re-apply the force-directed layout, click the "Auto Layout" button. If you click this button while nodes are selected, only those nodes will have the layout re-applied.
Using the mouse-wheel will scale the edges of your network (the gray connecting lines).
Some networks may contain many, many gray nodes because of the interacting partners of candidate genes.
To only show genes involved in connecting candidate and target nodes, you can click the "Hide Non-Connecting Nodes" button.
You can undo this at any time by clicking the same button again.
You can also hide the labels for the gray nodes by clicking the "Hide linker labels" button.
Clicking this button a second time will unhide the labels.
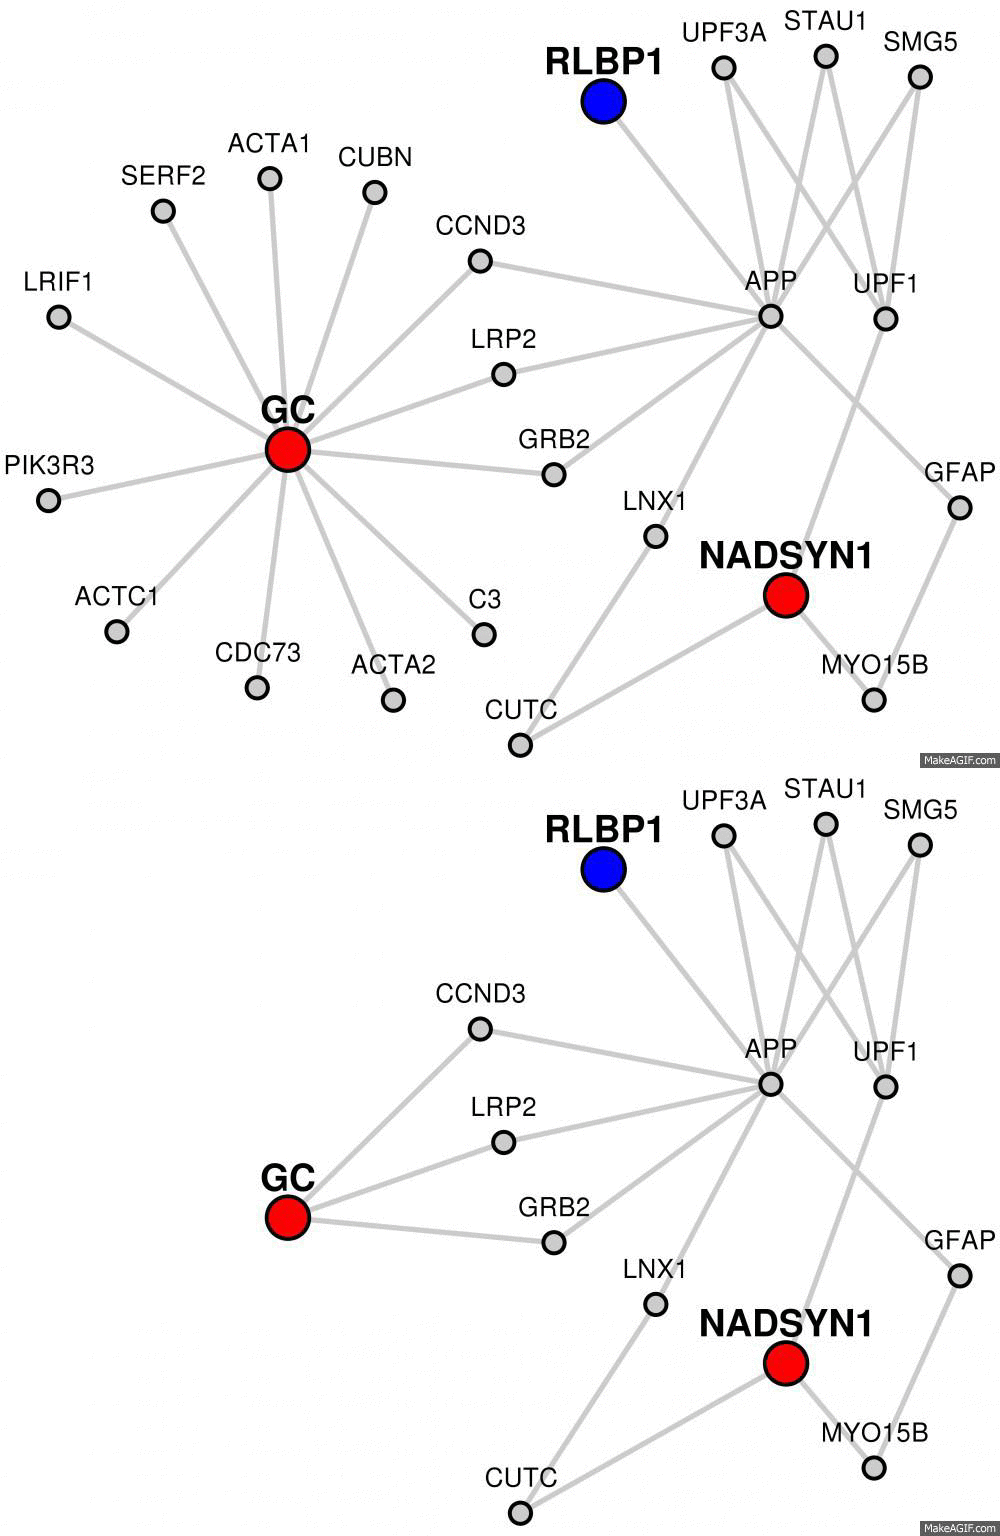
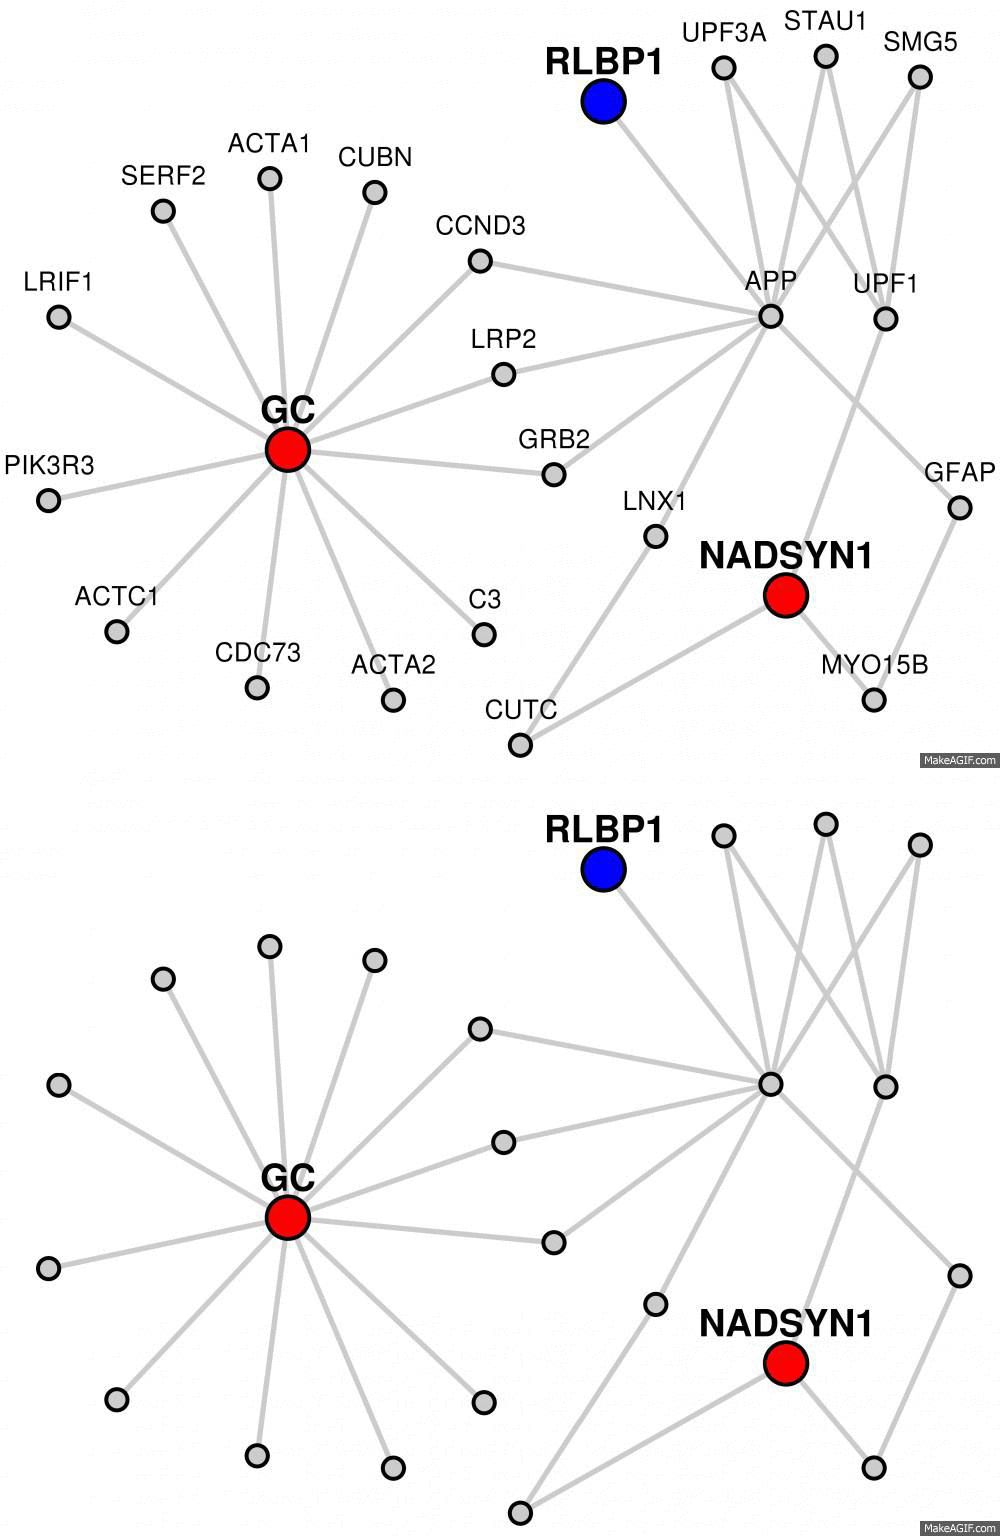
The labels for each node will default to whatever kind of identifier you used for your input. Using the "Display ID" option, you may choose to change the labels of genes to symbols, UniProt IDs, or Entrez IDs at any time.
You can investigate further into any gene or interaction by clicking on the circles or the gray edges that connect them. This will show the annotations of the gene or the interactions in the Wiki-Pi webserver. Wiki-Pi is a webserver of annotations of protein-protein interactions with a searcheable interface.
Network Statistics
Beneath the visual of the interactome are several tabs. Each tab has additional information about the network.Network Statistics tab shows three numbers: Minimum Shortest Path Length, Average Shortest Path Length, and Disconnected Nodes.
| Network | Min. Shortest Path Length | Avg. Shortest Path Length | Disconnected Nodes |
|---|---|---|---|
| Given Candidates | 4 | 4 | 0 |
| Random Candidates | 17 | 17 | 2 |
The Average Shortest Path Length looks at the shortest paths between all your candidate genes or all your candidate and target genes and computes the average. This value will differ slightly from what you see in the network visual.
If only candidate genes were given, shortest path distances are computed between all candidate gene pairs. If there is no shortest path, the distance is assigned a value of 17. If a target gene list is given, shortest path distances will be taken from each candidate to the nearest target. That is, if there are multiple target genes the candidate could have shortest paths to, only the minimum distance of those will be included in the calculation. If a candidate gene cannot connect to any target gene, a value of 17 will be assigned.
The Disconnected Nodes value represents the number of candidate genes that have no shortest paths. If only candidate genes were given, this means a disconnected candidate gene has no shortest paths to any other candidate. If a target list is given, a disconnected candidate gene has no shortest paths to any of the target genes.
In addition to computing these three values for the network generated by your input, LENS will also compute them for several random networks for reference.
If only a candidate list is given, LENS will generate five random networks using a random candidate list equal in size to the one provided. The average of each value will be reported inthe Network Statistics tab.
If a target list was also provided, numbers will be generated for three sets of random networks, each set containing five random networks. The first take the list of candidate genes provided and computes the statistics against random target sets equal in size to the one provided. The second network uses a random candidate list instead, but keeps the target list. The last network uses random candidate and target lists of equal sizes to the ones provided.
| Network | Min. Shortest Path Length | Avg. Shortest Path Length | Disconnected Nodes |
|---|---|---|---|
| Candidate to Target | 3 | 3.5 | 0 |
| Candidate to Random | 8.6 | 8.8 | 0.8 |
| Random to Target | 13.4 | 13.4 | 1.6 |
| Random to Random | 17 | 17 | 2 |
GWASs, Disease, Drugs, and Pathways Tabs
These four tabs display significance of overlap between the generated network and gene lists found in other databases. LENS will perform analyses of the entire network against data from the NHGRI GWAS Catalogue, KEGG Diseases, DrugBank Drugs, and REACTOME Pathways.The statistics are shown with two options: (a) Analysis of only Candidate Genes or (b) Analysis of all the genes in the network.
Any of the above sources that contain at least one gene from the network your input generated will appear in these four tabs. Each item will be displayed as a button with the name of the dataset that the overlap was found in. The label will also include two numbers, p and n. p is the p-value from a hypergeometric test for significance using your network, the other datasource, and a population of 20,000. At the top of each tab, you may choose to sort the data by p-value. n is the number of genes from your network that are found in the other dataset.
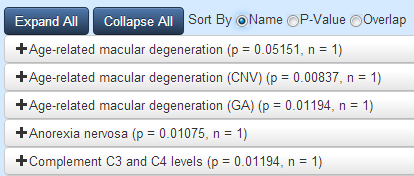
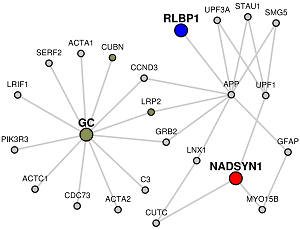
Clicking on any of these buttons will reveal a venn-diagram illustrating the overlap along with the list of genes in the overlap. If you look back to the generated network, the genes found to be overlapping will be filled in green.

Downloads
Several files can be downloaded from LENS. All of the download options can be found in the download menu at the bottom of the network visualization. You may download SIF formatted files for Cytoscape. Cytoscape is a standalone network visualization program written in Java. You can choose to download SIF files representing the entire network, or just the shortest paths.You can also download a text file containing a list of all the genes found in your network.
Images of your network can also be downloaded. For just the raw shape of the network without the coloring or styling, you can choose to download an SVG file. If you would like a copy of your network exactly as it appears, you can also download a high-quality PNG of your network. The PNG image appear exaclty as you see it in your browser.
Customizing
In addition to the changes you can make to the network visualization, there are two more items you may customize as you please.The very last tab under the network is entitled Notes. You may type whatever you choose into this text box for later reference.
At the very top of the screen, you will also notice the title, "Network Analysis Pipeline (LENS)". If you click on the title, you will be given the opportunity to modify/change it.

Nuts and Bolts
Several applications, languages, and plugins are used to make LENS possible.- Boostrap CSS is a free framework for webpages and was used to format LENS.
- D3 - Data Driven Documents is a JavaScript package that is responsible for the network layout
- JavaScript/JQuery is responsible for all the other dynamic content of LENS, including the autocomplete, venn diagrams, and more.
- FuelPHP is used to generate all webpages and handle server-side requests.
- Python & NetworkX are responsible for all computations regarding the interactome.
- Wiki-Pi & MySQL provide the data needed. Wiki-Pi gathers data from several sources to describe the human interactome and stores this data in a MySQL database.
- librsvg a unix utility for creating high-quality PNG images.
